
A fall foliage map built from the trees, not the latitude. Free, from More Than Just Parks, an independent, reader-funded public lands newsroom.
What this is
Every other fall foliage map is a picture of the country colored by latitude. It says the north turns first and the south turns last, which you knew. This one is built from the trees. It knows what species stands in every county and in every national park and forest, how high those trees grow, what this September’s weather is doing to them, and what cameras and people on the ground saw this week. Then it names the place. Not “western Montana” but Flathead National Forest, with its own date and its own week.
You can scrub it to any day of the year and watch the color move. You can type a ZIP and a weekend and get the parks and forests within reach, ranked by how close they’ll be to peak when you arrive. You can open a live forest camera before you drive. And it’s free, with no account, from a public lands newsroom that has spent a decade filming these places in the fall.
What it does that nothing else does
- It forecasts parks and forests as places
- It knows what’s growing
- Two trees, two peaks
- It knows how high the trees are
- It responds to this year
- It listens to the ground, carefully
- It runs all year
Our own decade in the field
Here’s the layer no one else can get. More Than Just Parks has been filming America’s public lands in the fall for more than a decade, and every frame carries a date and a location. Our library holds more than 107,000 frames. Over six thousand of them are geotagged autumn frames from the West alone, across more than 700 trip-days from the Flathead to the Colorado Plateau.
We read those frames the way a forester reads a stand. A frame from the Flathead Valley on 2 October 2018 becomes two readings, not one, because the cottonwood along the river was at 80 percent color and the larch above it hadn’t started, and those are two different trees on two different clocks. Every reading enters the forecast the same way a state forester’s report does, as evidence against the model rather than a number typed over it.
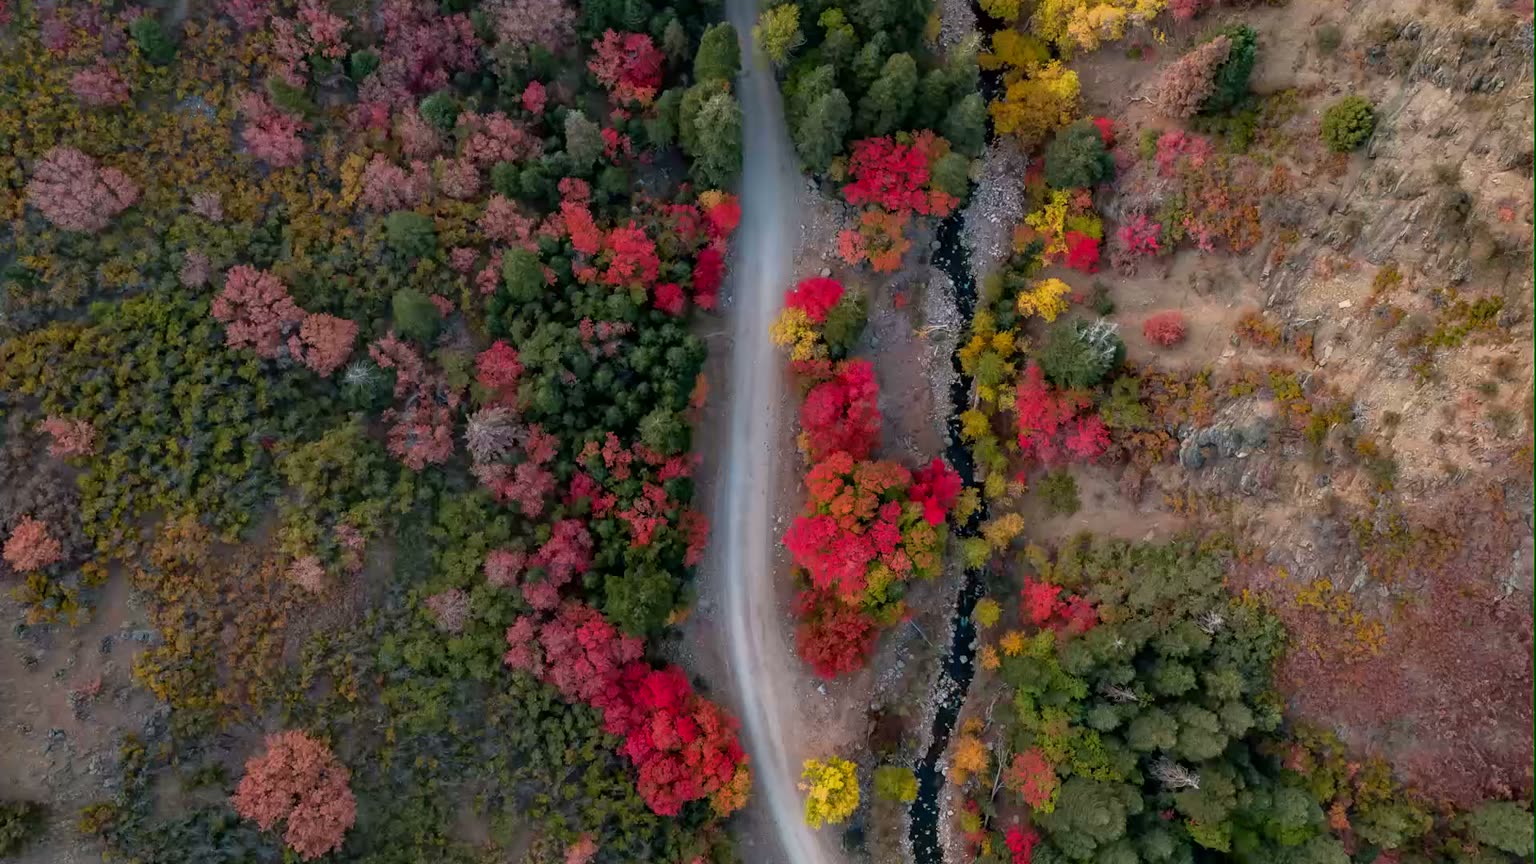
That archive is how we caught the model everyone else ships. A forecast built from latitude and elevation alone runs about ten days early across the northern Rockies and nearly three weeks early on the Colorado Plateau, and there are almost no research cameras out West to tell you so. Our frames told us so. The species layer that fixed it agrees with the old model to half a day on the Front Range and sits three weeks later in southern Utah, which is what our footage from Fishlake in October 2020 shows. The film on this page’s front door is that flight.
How it works, in plain words
Start with what grows there. For every county and every forecast place, read the species mix off the federal vegetation map. Add how high the trees stand. Fit the day each species turns against a decade of forest cameras and dated photographs, including ours. That gives every place a peak date for a normal year.
Then make it this year. Read the September temperature against normal and shift the dates. Read every report from a camera, a forester, an observer, a photograph, or our own crew, and let the ones that pass the gate pull the date toward what the ground says. Print a four-day window around the result, name the place, and show a live camera when there’s one nearby.
Then check ourselves. Every forecast is scored against long-running forest cameras that never saw it, and the whole scorecard is published on the methodology page, region by region, including where we’re weakest. Most maps never tell you. We’d rather you plan the drive knowing.
Who makes it
More Than Just Parks was founded by Jim and Will Pattiz, the Pattiz Brothers, filmmakers who have spent their adult lives documenting and defending America’s public lands. What began as documentary films seen by tens of millions of people has grown into an independent newsroom and a set of public lands tools.
We exist to protect America’s public lands, the forests and deserts, canyons and coastlines that belong to every American in common. Our work runs on three tracks. Investigative journalism on the threats to public lands and the people responsible, public lands tools like this one, and documentary film.
The reporting is funded entirely by readers. We take no money from the industries we cover. Land managers and Capitol Hill staff read us alongside more than 27,000 subscribers to our free daily briefing.
Why it’s free
Public lands belong to everyone, so a tool that helps you see them at their best should be free to everyone. This map will always be free to use, with no account required. If it helps you, the best way to support it is to read and share our journalism, sign up for the briefing, and tell a friend planning a trip.
How to reach us
Questions, corrections, a place that looks wrong, or a press inquiry: email ask@morethanjustparks.com. We read everything and we fix what we get wrong.
Every date on this site is a forecast: a model corrected by ground reports, carrying a measured error, published in full. Check conditions with the land manager before you travel. Last reviewed September 2026. Back to the forecast